| NCEP Humidity fluxes vertical sections |
|---|
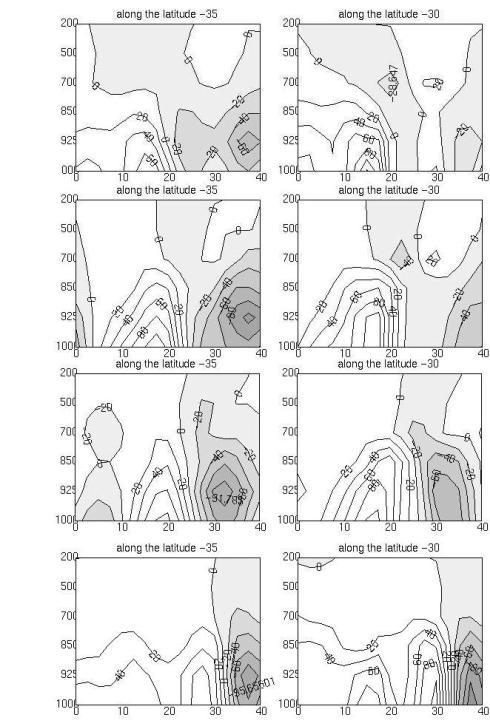
| Latitudinal cross sections of moisture flux provided further evidence of the moisture input to the storm region on 13 December at 35 S and 30 S show that from about 15 E to 20 E a moisture flux of 60-100 g*m/kg*s moved north towards the Western Cape and was mostly confined to the surface layers. East of 20 E (the longitude of Cape Agulhas), the pattern reverses and the moisture comes from the north with less magnitude. The general pattern remained the same on 14 and 15 December , however there was a substantial increase in the magnitude and vertical extent of the moisture flux from the Agulhas Current on 14 and on 15 the as boundary between the northward and southward moisture flux shifted from 20 E to 25 E. Since this boundary shift represents a substantial increase of about 500 km in the fetch of the winds above the Agulhas Current, it suggests that on 15 December the Agulhas Current moisture that was advected from the south played a larger role than on the previous days. On 16 December, the wind shifted from easterly to southwesterly, which can be seen in the latitudinal profile as an eastward shift to 30 E of the boundary of the northward moving moisture The latitudinal cross sections discussed above show horizontal shear in the moisture fluxes over the region. Horizontal shear in the atmosphere increases the vertical vorticity of the system and thus enhances upward motion. These cross sections also show the presence of vertical shear. This change in direction of the moisture flux with height in the atmosphere increases the horizontal vorticity, which is also favorable for atmospheric instability. As a result, it is not just the flux of moisture from the Agulhas Current and tropical sources that contributes to the storm development but also the horizontal and vertical shear in these fluxes that is significant. NCEP moisture flux transects have shown that moisture was available to this storm from both the north and from the Agulhas Current region. At low levels, the most significant moisture source appears to be the Agulhas Current region. |
 |
|


[Abstract| Introduction| Agulhas Current | TRMM SST| Cloud Lines | Questions| Synoptic settings.| Rainfall| Visible Meteosat| Infrared Meteosat| The Movies| TRMM Orbits| TRMM Precipitation| TRMM zoom| TRMM vertical section| Humidity flux 1| Humidity flux 2|
 Humidity flux vertical sections|
Conclusion|
References
Thanks]
Humidity flux vertical sections|
Conclusion|
References
Thanks]
Email: rouault@physci.uct.ac.za
Forum