| NCEP Humidity flux |
|---|
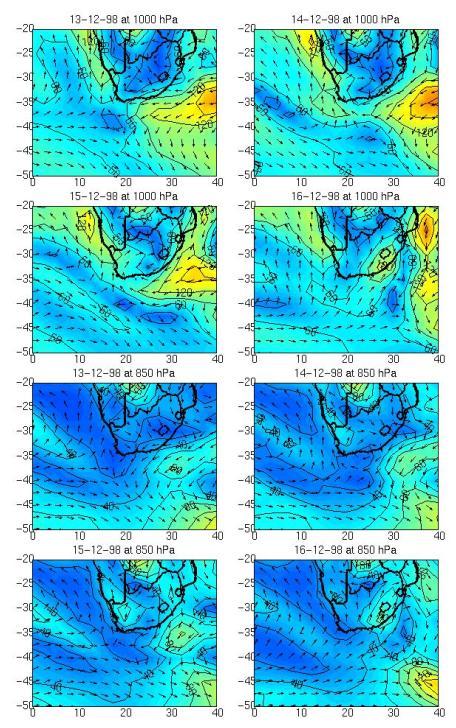
| Moisture flux diagrams were constructed from NCEP specific humidity and wind data. They show that about 140 g*m/kg*s of moisture was advected into the storm region at the 1000 h-Pa level on December 13 and 14. This moisture was advected from above the Agulhas Current by the easterly to northeasterly winds that compose the trailing edge of the anticyclone located in the South West Indian Ocean. Although NCEP specific humidity data shows relatively large amounts of moisture in the tropics, little was advected towards the storm region. The winds in the tropical regions of greatest specific humidity were weak and not consistently in the same direction over a large fetch area as those in the South West Indian Ocean. |
 |
|


[Abstract| Introduction| Agulhas Current | TRMM SST| Cloud Lines | Questions| Synoptic settings.| Rainfall| Visible Meteosat| Infrared Meteosat| The Movies| TRMM Orbits| TRMM Precipitation| TRMM zoom| TRMM vertical section|
 Humidity flux 1|
Humidity flux 2|
Humidity flux vertical sections|
Conclusion|
References
Thanks]
Humidity flux 1|
Humidity flux 2|
Humidity flux vertical sections|
Conclusion|
References
Thanks]
Email: rouault@physci.uct.ac.za
Forum