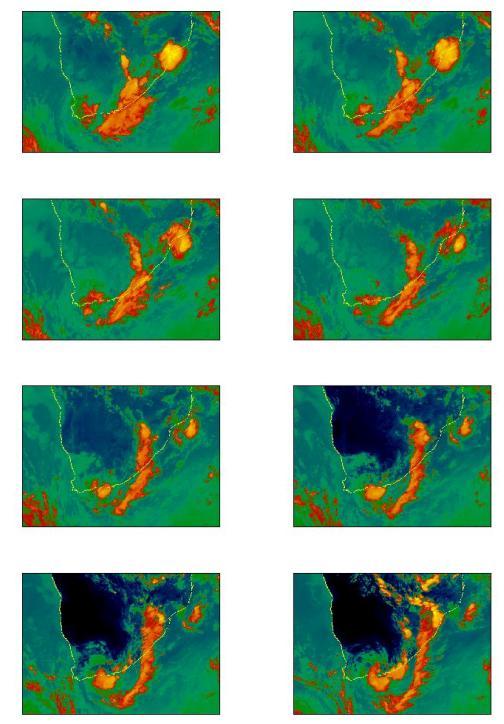
| Infrared Meteosat derived cloud top temperature |
|---|
| According to Meteosat derived rain rate data, Meteosat cloud top temperature and Meteosat Water vapor brightness temperature, the beginning of the heavy rainfall over the Tygerhoek region of the Western Cape occurred at about 10 UTC on December 14 as the storm spun up with associated deepening and entrainment of the surrounding air. Meteosat visible infrared and water vapour imagery for December 14 shows a slow eastward moving system of organized convective thunderstorm cells and squall lines. Animation of the infrared imagery indicates that a large circular area of convection was organised over the region during the late afternoon and evening hours of December 14. While cloud top temperatures and the extent of the cold cloud shield were such as to satisfy the criteria for a mesoscale convective complex, these did not last long enough (6 or more hours required) to be so classified. Later on December 14 (around 21 UTC), the organised convection became linear in form and was both of long enough duration and sufficiently extensive to be classified as a squall line (at least 6 h and 650 km long). On December 15 the storm deepened and shifted slightly eastward . The single squall line that was observed propagating east across South Africa until around 15 UTC December 15 was joined by a second squall line feature that appeared to develop around this time from the storm center over the south coast and neighboring warm waters to the south. Meteosat water vapor and NCEP Reanalysis data (shown later) indicate that dry air in the mid to upper troposphere that was advected over the region by the westerly wave on December 14 was now transported to the north and north east of the storm center. |
 |
|


[Abstract| Introduction| Agulhas Current | TRMM SST| Cloud Lines | Questions| Synoptic settings.| Rainfall| Visible Meteosat|
 Infrared Meteosat|
The Movies|
TRMM Orbits|
TRMM Precipitation|
TRMM zoom|
TRMM vertical section|
Humidity flux 1|
Humidity flux 2|
Humidity flux vertical sections2|
Conclusion|
References
Thanks]
Infrared Meteosat|
The Movies|
TRMM Orbits|
TRMM Precipitation|
TRMM zoom|
TRMM vertical section|
Humidity flux 1|
Humidity flux 2|
Humidity flux vertical sections2|
Conclusion|
References
Thanks]
Email: rouault@physci.uct.ac.za
Forum