James Test
To determine if the differences between the drifter and the respective
model mean velocity fields are significant over the domain, we apply a James
test (Seber, 1984), which can be used to statistically compare two vector
fields with different variances. The mean velocity fields used in the test
are the 2°x 2° binned velocities from the drifter
trajectories and the two sets of numerical trajectories. Details of the James
test are found in Appendix A. The Figures below show the results of the James
test using the drifter velocities and the 0.28° and 0.1° model fields, respectively. The gray shading
indicates that the null hypothesis of equal
means is rejected for those bins with a possibility of being incorrect 5% of
the time. In other words, the means are signficantly different in these bins
when a 95% significance level is used. |
||
|
|
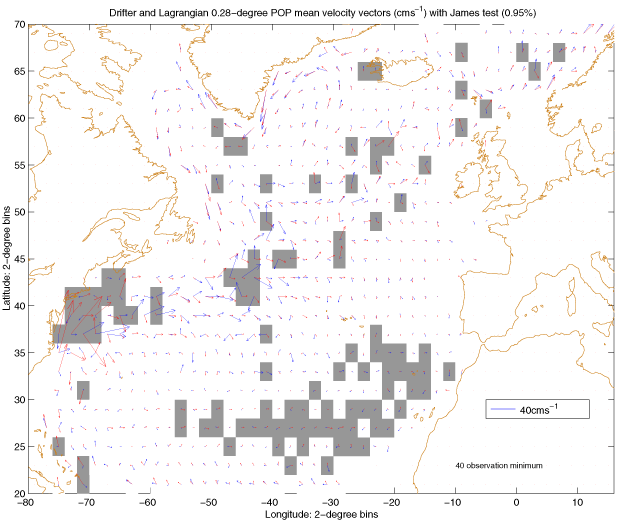
Drifter - 0.28° Model Velocities Comparison The regions with significantly different means
are those already identified qualitatively as being erroneous in the model
field. Significantly different mean flows are found in the anticyclone off
Cape Hatteras, at the point where the true GS turns to the northeast to enter
the NAC, at the location where the model turns to the northeast too far
across the basin, and in the region where the model displays a fictious zonal
current in the southeast sector of the domain. Also in this part of the domain, the flow is fairly quiescent
and motions are rambling and circuitous so it is therefore not surprising
that the weak mean flows are significantly different. |
|
|
|
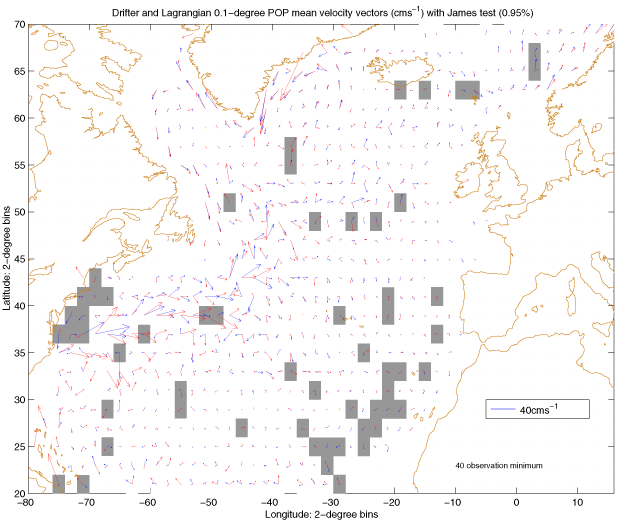
Drifter - 0.1° Model Velocities Comparison There are fewer significantly different model and
drifter means than in the 0.28° case. Again these regions were
identified previously: over the mid-Atlantic Bight where the 0.l° model flow is in the wrong direction and in the CC region where
the model does not resolve a coherent
flow. In all, in regions of strong currents and in most quiescent
flows the drifter and 0.1° POP means do not differ significantly. |
|
|
|
||
|
|
|
|