Year-long Averages of the
Mapped Pressure and Current Fields
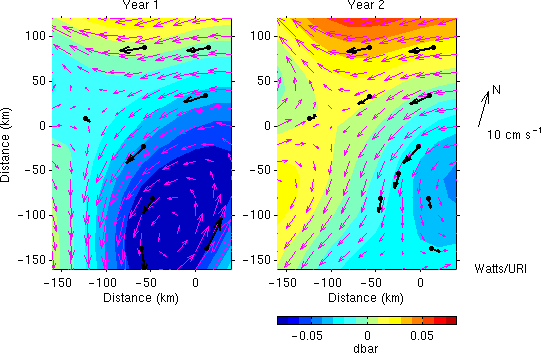
- Year 1: 16 June 1988 to 24 May 1989
- Year 2: 29 August 1989 to 7 August 1990
-
Measured Currents averaged over same time
periods shown by black arrows
Features common to both years:
- Westward flow in the northern portion shoreward of the 4000 m isobath, approximately parallels the bathymetry.
- Abyssal cyclone is present but shifted to the east by roughly 60 km in Year 2


