Variability of the Mean Positions and Transport
|
When the latitude of the Kuroshio Extension at the first crest
shifts northward (southward), the volume transport decreases (increases) and the
longitude of the Bifurcation Point shifts westward (eastward).
|

|
Time series of the latitude (green) and volume transport (red) of the
Kuroshio Extension at the first crest, and of the longitude of the
Bifurcation Point (blue).
|
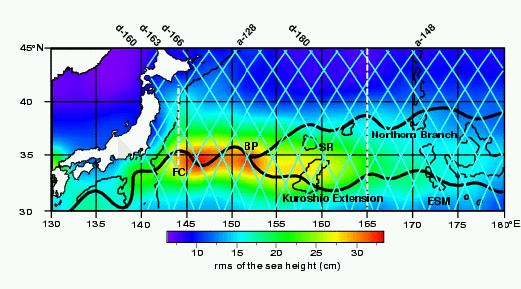
The maximum of rms values of the sea height near 153°E; agrees with
the mean location of the Bifurcation Point.
|
|
Although the presence of the Shatsky Rise may influence
the location of the Bifurcation Point, its variability and relation
with upstream water transport and latitude of the axis also suggest
hydrodynamical causes.
|
However, changes in the decreasing rate of water transport at the
Kuroshio Extension near 160° and 170°E,
the southward deflection of the Kuroshio Extension axis near
160°E, and the location of the Northern Branch path
are probably related with the topographic features.
|