Velocity Structure >>
Potential Vorticity Structure >>
Eddy Exchange Processes >>
Discussion and Conclusions
Velocity Structure >>
Potential Vorticity Structure >>
Eddy Exchange Processes >>
Discussion and Conclusions
Velocity Structure
Eulerian and Stream coordinate mean fields
| Eulerian Mean | |
|
|
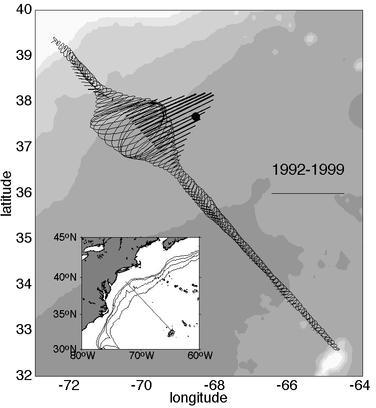
| Figure 1. The Eulerian mean field and variance ellipses at 52 m depth from >300 sections across the NW Atlantic. The maximum velocity vector is 500 km from New Jersey. The direction of mean flow is 65°. The solid dot indicates the location of the H4 mooring in SYNOP (37° 40'N 68° 35'W). The scale to the right indicates 1 m/s and 1 J/kg. Bathymetry is indicated in 1000 m increments. | |
| A more organized pattern of flow emerges when the data are plotted in a stream coordinate system. | |
|
|
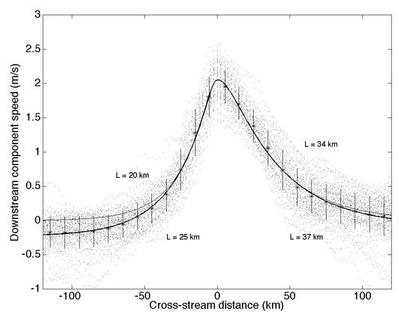
| Figure 2. The stream-averaged velocity field of the Gulf Stream at 52 m depth using the same sections as in Figure 1 (above). The dots indicate all velocity components parallel to the maximum velocity vector. The heavy line indicates an exponential fit to these excluding data within 10 km of the maximum (the scale-widths are indicated). The error bars indicate standard deviations in 20 km increments. The light line exponentials are forced to asymptote to zero. | |
| The mean velocity estimates are used to estimate an exponential fit to either side of the velocity maximum. | |
| Force the velocity to zero at large |y| (light line in Figure 2). | Allow the fit to asymptote to the mean flow of the recirculating gyres for large |y| (heavy line in Figure 2). |
|
u(y) = 2.61exp(y/20) - 0.56exp(y/5) (y<0)
u(y) = 2.75exp(-y/34) - 0.7exp(-y/8) (y>0) |
u(y) = 2.61exp(y/25) - 0.33exp(y/3)-0.23 (y<0)
u(y) = 2.75exp(-y/37) - 0.62exp(-y/3)-0.08 (y >0) |
| This set better represents the total velocity field, but includes the substantially barotropic component of -0.23 and -0.08 m/s in the recirculation gyres north and south of the Gulf Stream (Hogg, 1992). | |
| Meandering versus mesoscale eddies | Velocity and deformation scales | Thermal structure |

|

|