|
Most of the variance in the Eulerian average comes from the
meandering of the structurally invariant current.
This is shown in two ways.
Approach 1
Take the observed positions and
directions of maximum flow for each and every section and replace all
data with data using the analytical form (light line) shown in Figure
2 after projecting them onto the ship's track.
|
Eulerian mean
|
Resulting mean field and variance ellipses.
|
|
|
|
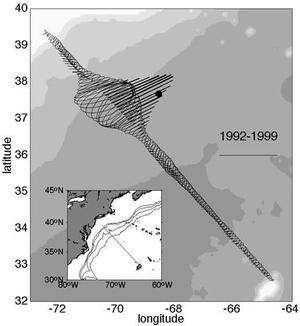
Figure 1. The Eulerian mean field and variance ellipses at 52 m depth
from >300 sections across the NW Atlantic
|
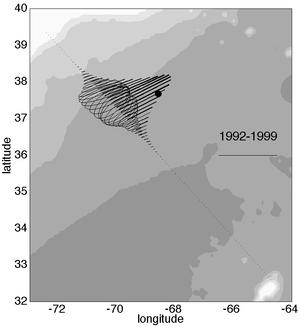
Figure 3: Synthesis of the Eulerian Gulf Stream statistics by mapping
the exponential fit (light line) in Figure 2 back onto the Oleander track. Only the
position and direction of the maximum velocity vector are used to
orient the double exponential function.
|
-
The similarity with the observed Eulerian mean fields in
Figure 1 is striking.
-
The
velocities are almost identical as are the shapes and orientations of
the variance ellipses.
Approach 2
Compare
the eddy statistics for the two cases, the original data set (solid
line) and the synthetic data set (dashed line).
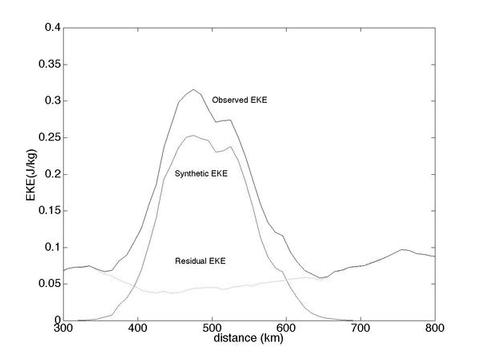
Define a 'residual eddy kinetic energy' (rEKE) by
subtracting the analytical representation of the Gulf Stream from the
observations (dotted line) in Figure 4 (below).
|
|
Figure 4. The three curves show the velocity variance in 1) stream
coordinates from the observed data, 2) using only the light line
double-exponential form in Figure 2, and 3) after first removing the
same double exponential function from each transect. The abscissa
shows distance in km from New Jersey.
|
-
80% of the observed EKE in the center of the current can be accounted
for by the
meandering of a rigid stream.
-
But
the difference in peak EKE between the observed and synthetic EKE,
while comparable, is actually less than the general EKE level to the
sides of the Gulf Stream (0.07-0.09 J/kg).
-
The rEKE, which measures the departures of the observed
velocity field from the double-exponential form, remains nearly
invariant across the entire region, but it too evinces a clear
minimum at the center of the current indicating less departure from
the 'ideal' form at the center than anywhere else.
|
|
In summary, here
as at the Pegasus line, most of the observed variance in the region
of the Gulf Stream stems from the meandering of the current itself,
about 67% of the total between 0 and 2000 m at the Pegasus line (HR)
and 80% along the Oleander line at 52 m depth.
|
|
