The overall goal of the Kuroshio Extension System Study (KESS) is to
identify and quantify the dynamic and
thermodynamic processes governing the variability of and the
interaction between the Kuroshio Extension and the
recirculation gyre. Investigators from three US institutions (University of
Rhode Island, Woods Hole Oceanographic Institution and University of Hawaii)
deployed a state-of-the-art array consisting of moored-profiler and
current-meter moorings and inversted echo sounders equipped with near-bottom
pressure and current sensors
(CPIES)
from 2004 to 2006.
URI Principal Investigators: (Full
list of US KESS PIs)
- D. Randolph Watts
- Kathleen A. Donohue
KESS array of inverted echo sounders equipped with bottom pressure
gauges and current meters
(CPIES, diamonds), moored profilers (MPs, stars) equipped with
upward-looking acoustic Doppler current profilers (ADCPs) and deep
current meters, and
KEO surface
buoy (triangle).
Argo profiling floats were
deployed within the green boxed region to measure the temperature and
salinity fields. Thin light blue lines indicate Jason 1
ground tracks. Solid lines are the GDEM mean surface dynamic height
contours in dyn cm from Teague et al. (1990). The 2000 and 4000 m
isobaths are shaded dark and light gray respectively.
Eddy kinetic energy > 0.18 and 0.23 m2s-2 is
color shaded yellow and orange respectively. CTD/SADCP observations were
made at all CPIES sites.
The moored array was designed to measure the time-varying density and
velocity fields with the 4-D mesoscale resolution required to
determine dynamical balances and cross-frontal exchanges of heat,
salt, momentum, and PV. The high-resolution
in situ
instrument array was centered on the first quasi-stationary meander
trough east of Japan, indicated by the GDEM mean surface dynamic height
contours (black in above figure). The array was located in
the region of highest eddy kinetic energy
(yellow and orange shadings).
The in situ observations
spanned a two-year period. The instruments
were deployed on a cruise aboard the R/V Thompson in Spring 2004
(Deployment Cruise Summary).
On a mid-experiment cruise conducted during June-July 2005 aboard
the R/V Revelle, the
moored profiler moorings were recycled and their data collected. Daily
measurements of pressure, travel time and currents were telemetered to
the ship from the CPIES and a CTD/ADCP feature survey was conducted.
The moored instruments were recovered during May and June 2006 on a cruise
aboard the R/V Melville.
Additional information about the KESS cruises, including cruise reports,
may be found on the US KESS website under the
cruises link.
Back to Top
Two States of Variability
Satellite altimetry shows the Kuroshio Extension alternates between
relatively stable and vigorous meandering intervals on decadal time
scales (Qiu and Chen, 2005).
The Kuroshio extension transitioned between these two states
in fall 2004. SSH fields for the stable period (below left) show two nearly
stationary meanders and a westward propagating warm core ring in the KESS
region. During the active period (below right), a steep trough develops
and a cold core ring forms.


Upper (contours in cm) and Deep (color in dbar) Mean Streamfunctions
During the stable period (below left), the upper mean streamfunction
shows a well-defined KE front and recirculation gyre SW of a mean weak
meander trough. Anticyclonic circulation in the deep streamfunction is
the deep expression of the southern recirculation gyre. There is weak
cross-frontal flow under the trough. During the active period (below right),
there is increased meandering which produces weaker lateral gradients across
the KE mean front. Both the trough and cold core ring are evident
in the mean. Deep features are intensified during the active period.

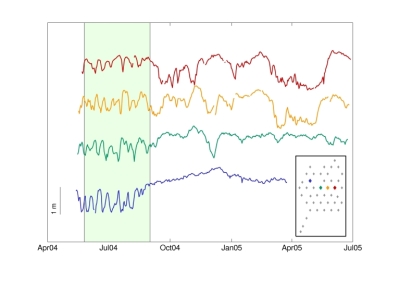
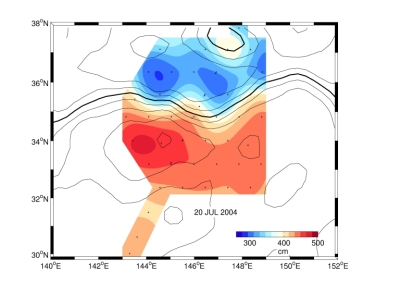
Mesoscale features alias satellite SSH
From May to September 2004 (below left, the green hatched area
in SSH (m) time series) a series of rapid, eastward propagating
(25-30 km/d) meanders were observed by the CPIES.
These short wavelength (160 km) meanders were not
resolved by satellite SSH (below right, SSH colors and contours in cm).
Jet interaction with deep eddies
A meander trough steepens during December 2004 and pinches
off a cold core ring. A movie
shows this ring formation in more detail.
Deep cyclones and anticyclones move from the northeast
to southwest. Upper and deep layers interact and jointly intensify. Deep
eddies play an important role in the pinch-off process. Velocity is shown by
arrows in cm s-1. SSH is shown by contours (in cm) and
color (in dbar), red is high and blue is low. Peak values are
-0.25 and 0.25 dbar.

Back to Top
Plan-view maps in movies show several observations:
- Deep pressure field anomaly in color
- Upper streamfunction by the gray and black contours
- Bottom velocities vectors: measured (black) and mapped (gray)
- Argo float tracks with unique colors and symbols used for each float
| Movie 1: |
Movie 2: |
Movie 3: |
 |
 |
 |
Daily Maps for the two-year
period
1 June 2004 to 1 May 2006 (82 Mb)
|
Daily Maps with superimposed
Argo Float
tracks for the two year
period 1 June 2004 to 1 May 2006
(80 Mb) |
Daily Maps for the period of Ring 04B formation, 15 November 2004 to
31 January 2005 (13 Kb) |
Publications
- Bishop, S. P.
The Role of Eddy Fluxes in the Kuroshio Extension at
144°-148°E.
PhD dissertation, University of Rhode Island, Graduate School of
Oceanography, 2012.
128 pp.
(PDF)
- Bishop, S. P., and F. O. Bryan.
A comparison of mesoscale eddy heat fluxes from observations and a
high-resolution ocean model simulation of the Kuroshio Extension.
J. Phys. Oceanogr., 45:2563–2570, 2013.
(doi:10.1175/JPO-D-13-0150.1)
- Bishop, S. P., and D. R. Watts.
Rapid eddy-induced modification of subtropical mode water during the Kuroshio
Extension System Study.
J. Phys. Oceanogr., 44:1941–1953, 2014.
(doi:10.1175/JPO-D-13-0191.1)
- Bishop,
S. P., D. R. Watts, J.-H. Park, and N. G. Hogg.
Evidence of bottom-trapped currents in the Kuroshio Extension region.
J. Phys. Oceanogr., 42(2):321–328, 2012.
(doi:10.1175/JPO-D-11-0144.1)
- Bishop,
S. P., D. R. Watts, and K. A. Donohue.
Divergent eddy heat fluxes in the Kuroshio Extension at
144°–148°E. Part 1: mean structure.
J. Phys. Oceanogr., 43:1533‐1550, 2013.
(doi:10.1175/JPO-D-12-0221.1)
- Bishop, S. P.
Divergent eddy heat fluxes in the Kuroshio Extension at
144°–148°E. Part II: spatiotemporal variability.
J. Phys. Oceanogr., 43:2416‐2431, 2013.
(doi:10.1175/JPO-D-13-061.1)
- Donohue, K.,
D. R. Watts, K. Tracey, M. Wimbush, J.-H. Park, N. Bond, M. Cronin, S. Chen,
B. Qui, P. Hacker, N. Hogg, S. Jayne, J. McClean, L. Rainville, H. Mitsudera,
Y. Tanimoto, and S.-P. Xie.
Program studies the Kuroshio Extension.
EOS, Transactions, AGU, 89(17):161–162, 2008.
(doi:10.1029/2008EO170002)
- Donohue, K. A., D. R. Watts, K. Tracey,
A. D. Greene, and
M. Kennelly.
Mapping circulation in the Kuroshio Extension with an array of Current
and Pressure recording Inverted Echo Sounders.
J. Atmos. Oceanic Technol., 27:507–527, 2010.
(doi:10.1175/2009JTECHO686.1)
- Fearing,
A. L., K. A. Donohue, and D. R. Watts.
Sea surface height variability in the Kuroshio Extension.
SURFO Technical Report 2006-02, University of Rhode Island, 2006.
(PDF)
- Greene,
A. D., G. G. Sutyrin, and D. R. Watts.
Deep cyclogenesis by synoptic eddies interacting with a seamount.
Journal of Marine Research, 67(3):305–322, 2009.
(doi:10.1357/002224009789954775)
- Greene,
A. D., D. R. Watts, G. G. Sutyrin, and H. Sasaki.
Evidence of vertical coupling between the Kuroshio Extension and
topographically controlled deep eddies.
Journal of Marine Research, 70(5):719–747, 2012.
(doi:10.1357/002224012806290723)
- Greene, A. D.
Deep Variability in the Kuroshio Extension.
PhD dissertation, University of Rhode Island, Graduate School of
Oceanography, 2010.
150 pp.
(PDF)
- Howe, P. J.
Stream-coordinate structure and variability of the Kuroshio extension.
M.S. thesis, University of Rhode Island, Graduate School of Oceanography,
2008.
123pp.
(PDF)
- Howe, P. J.,
K. A. Donohue, and D. R. Watts.
Stream-coordinate structure and variability of the Kuroshio Extension.
Deep-Sea Res. I, 56(7):1093–1116, 2009.
(doi:10.1016/j.dsr.2009.03.007)
- Jayne, S. R.,
N. G. Hogg, S. N. Waterman, L. Rainville, K. A. Donohue, D. R. Watts, K. L.
Tracey, J. L. McClean, M. E. Maltrud, B. Qiu, S. Chen, and P. Hacker.
The Kuroshio Extension and its recirculation gyres.
Deep-Sea Research I, 56(12):2088–2099, 2009.
(doi:10.1016/j.dsr.2009.08.006)
- Kennelly,
M., K. Donohue, A. Greene, K. L. Tracey, and D. R. Watts. Inverted echo sounder data report: Kuroshio Extension System Study
(KESS), April 2004 to July 2006.
GSO Technical Report 2008-02, University of Rhode Island, 2008.
(PDF)
- Na, H., J.-H. Park,
D. R. Watts, K. Donohue, and H. J. Lee.
Near 13-day barotropic ocean response to the atmospheric forcing in the North
Pacific.
J. Geophys. Res., 117(C12019), 2012.
(doi:10.1029/2012JC008211)
- Na, H., D. R.
Watts, J.-H. Park, C. Jeon, H. J. Lee, M. Nonaka, and A. D. Greene.
Bottom pressure variability in the Kuroshio Extension driven by the
atmosphere and ocean instabilities.
J. Geophys. Res.: Oceans, 121(8):6507–6519, 2016.
(doi:10.1002/2016JC012097)
- Park, J.-H.,
D. R. Watts, K. A. Donohue, and S. R. Jayne.
A comparison of in situ bottom pressure array measurements with GRACE
estimates in the Kuroshio Extension.
Geophys. Res. Lett., 35(L17601), 2008.
(doi:10.1029/2008GL034778)
- Park, J.-H.,
K. A. Donohue, D. R. Watts, and L. Rainville.
Distribution of deep near-inertial waves observed in the Kuroshio
Extension.
Journal of Oceanography, 66(5):709–717, 2010.
(doi:10.1007/s10872-010-0058-0)
- Park, J.-H.,
D. R. Watts, K. A. Donohue, and K. L. Tracey.
Comparisons of sea surface height variability observed by pressure-recording
inverted echo sounders and satellite altimetry in the Kuroshio Extension.
J. Oceanogr., 68:401–416, 2012.
(doi:10.1007/s10872-012-0108-x)
- Qiu, B., S. Chen, K. A. Donohue, D. R. Watts, H. Mitsudera, N. G. Hogg and S. R. Jayne.
Observations of the Subtropical Mode Water Evolution from the Kuroshio Extension System Study.
J. Phys. Oceanogr., 36:457–473, 2006.
(doi:10.1175/JPO2849.1)
- Tracey, K. L., D. R. Watts, K. A. Donohue, and H. Ichikawa.
Propagation of Kuroshio Extension meanders between 143°E and 149°E.
J. Phys. Oceanogr., 42:581–601, 2012.
(doi:10.1175/JPO-D-11-0138.1)
- Zamorski, S. E.
Kuroshio Extension meanders: model data-intercomparison.
M.S. thesis, University of Rhode Island, Graduate School of Oceanography,
2012.
65pp.
(PDF)
References
- Qiu, B., and S. Chen, Variability of the Kuroshio Extension jet,
recirculation gyre and mesoscale eddies on decadal timescales.
J. Phys. Oceanogr., 35, 2090-2103, 2005.
(doi:10.1175/JPO2807.1)
- Vizcarra, N. B.
Probing the Black Current.
Sensing our Planet: NASA Earth Science Research Features,
22–25, 2010.
(PDF)
 KESS is
funded by the National Science Foundation
under Grant Numbers 0221008 and 0851246.
KESS is
funded by the National Science Foundation
under Grant Numbers 0221008 and 0851246.
Disclaimer:
Any opinions, findings and conclusions or recomendations expressed in
this material are those of the author(s) and do not necessarily reflect
the views of the National Science Foundation (NSF).
