Tomography Altimeter Comparison
|
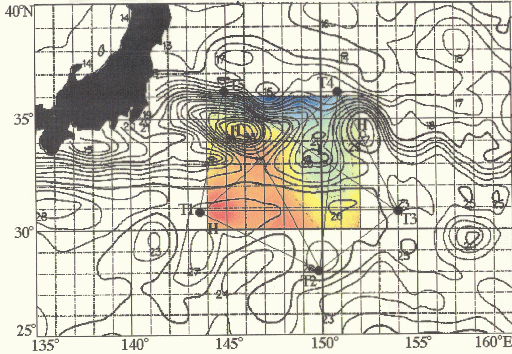
Sea surface height (SSH) derived from T/P altimeter and the
temperature field at 200 m show the meander of the Kuroshio Extension.
|
|
Contour map of sea surface height (SSH) derived from the
T/P altimeter on August 18, 1997 (provided by Kuragano at JMA),
superimposed on horizontal temperature field at 200 m determined from
the tomographic measurement on the same day. The 1500 db surface is
assumed to be the level of no motion.
|
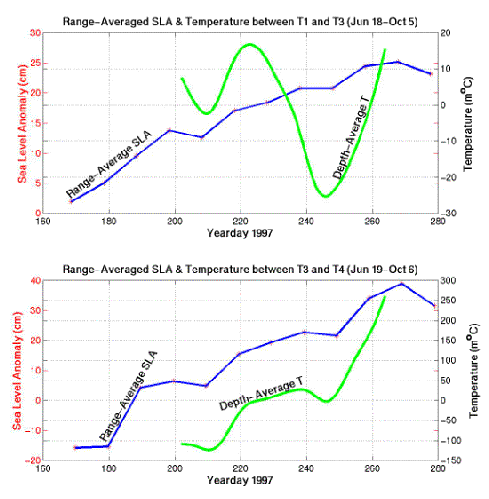
The comparison between tomographic-derived temperature anomaly
and sea level anomaly is good for T3-T4
in the Kuroshio Extension front region, but shows
large difference for T1-T3 Kuroshio Extension recirculation region.
Why?
|
|
Comparison of the range-averaged sea level anomaly (SLA)
and the estimated range-and depth-averaged temperature anomaly for
vertical section T1-T3 (top) and T3-T4 (bottom).
|
The acoustic tomography is able to
measure signals associated with the seasonal thermocline
(sea surface layer) and permanent thermocline (subsurface layer)
changes, but the altimeter mainly picks up the signal associated
with the variation occurring above the seasonal thermocline in the
recirculation region.
|
A new approach is presented for the inversion of
the acoustic travel times to separate and quantify the temperature
variations between the seasonal and permanent thermocline.
|

|