Graduate School of Oceanography Ferry-based Observations for Science Targeting Estuarine Research in Long Island Sound University of Rhode Island Homepage

Gridded Data Products


• Gridded Data Products (GDPs) are distributed here primarily to make these ferry-based measurements available (disclaimer) to researchers in a convenient and useful format. For example, numerical modelers can use the GDPs to improve fidelity of hydrodynamic simulations used for water quality management purposes.

• The GDPs have been created, from the raw measurements, through a series of processing stages including quality control that removes data not deemed of sufficient quality. For details, see the technical reports. (Download 2007 technical report as PDF.) (Download 2012 technical report as PDF.) [get free Adobe Acrobat Reader, needed to view PDF files]). To obtain data from other processing stages, email dcodiga@uri.edu.

• The map below shows where the fixed GDP grid locations, or “virtual stations”, are located (superposed on the 20/40/60/80-meter bathymetric contours). There are 18 grid locations: 17 (named “R01” – “R17”) spanning The Race north to south, and one (named “G01”) in Plum Gut.
GDP Grid Locations

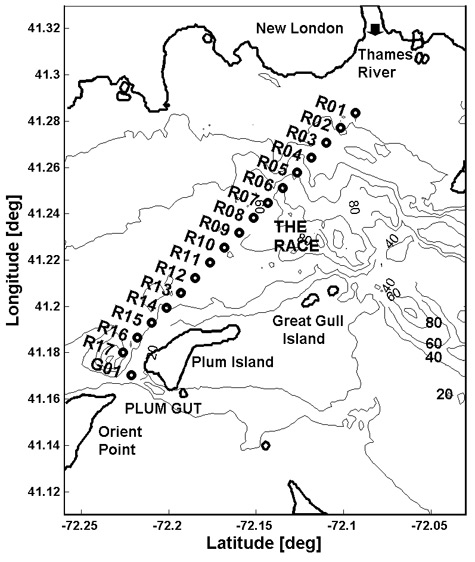
• GDPs consist of archived observations, to which additional data are periodically appended as they become available and undergo processing. In its present implementation this website is not intended to serve data in real time. To date, the most recent data in the GDPs are from June 2011. The velocity sampling periods span from late 2002 through 2006 and from April 2010 through early June 2011. The water properties sampling periods span from early summer 2005 to late summer 2006 (temperature, salinity, and Chlorophyll) and from April 2010 through early June 2011 (temperature and salinity, not Chlorophyll).

• Gaps in the record lasting a few hours to a few days are due to poor data quality, which generally arises in association with a rough sea state. Gaps of weeks to months correspond to periods when the sensors required maintenance and were not sampling, and/or to periods when the vessel underwent maintenance work and was not operating.

• Various GDP files may be downloaded. Each file is available in two formats: ASCII (text format) and MAT (binary Matlab format; version 7 or higher of Matlab is required). A header or “readme”, with explanations of the data content and format, is provided in each file. Certain browsers may require you to use the right-click menu to properly download the files.


VELOCITIES GDP

The following compressed "zip" files include (a) a grid information file, containing the latitudes, longitudes, bathymetric depths, and velocity depth intervals of all the virtual stations; (b) 18 time-sequence files for all available years of water velocity profiles; and (c) the two technical reports as PDF files:
FOSTERLIS_vel_asc_Dec2012.zip (about 16 megs; ASCII format) FOSTERLIS_vel_mat_Dec2012.zip (about 26 megs; mat format)
[ For users who (a) downloaded and used velocities prior to May 2012, and who also (b) would prefer to continue using the GDP created using the depth-based mapping instead of transitioning to use the fractional-depth based mapping results in the above zipfiles:
FOSTERLIS_velzmap_asc_May2012.zip (about 17 megs; ASCII format) FOSTERLIS_velzmap_mat_May2012.zip (about 28 megs; mat format)
These differ from the first pair of zipfiles above only in that they contain GDP results from the original depth-based mapping instead of the updated fractional-depth based mapping (see 2012 Technical Report for full explanation). ]


SURFACE WATER PROPERTIES GDP

The following compressed "zip" files include (a) the grid information file (see above); (b) 18 time-sequence files for all available years of surface water properties ("swp"); and (c) the two technical reports as PDF files:
FOSTERLIS_swp_asc_May2012.zip (about 2.6 megs; ASCII format) FOSTERLIS_swp_mat_May2012.zip (about 3.2 megs; mat format)