Method
PCM-1 moored array
The PCM-1 moored current meter array was deployed in the East Taiwan Channel (ETC) between September 1994 and May 1996 as part of the World Ocean Circulation Experiment (WOCE). It consisted of 11 moorings, with two upward-looking ADCPs mounted on T3 and T4 to resolve the Kuroshio core, and deep current meters on T5 and T6 to measure the flow entering the deep central gap of the channel. All conventional current meters measured temperature in addition to current speed and direction. Additional temperature loggers and CTD sensors were included in this array to measure the Kuroshio cross-channel temperature structure. The derivation of the gridded v and temperature fields can be seen in Johns et al. (2000).
 Schematic of the western boundary currents
with estimated mean transports in the vicinity of
the East China Sea (after Nitani, 1972). The
striped area east of Taiwan marks the East Taiwan Channel, where the
WOCE PCM-1 moored current meter array was deployed.
(lower panel) Moorings and tide gauge locations on the topography of
the Ilan Ridge. shaded area indicates depth less than 200 m.

(top) Temperature transport-average ‹v›t‹theta›t cross section of PCM-1 array. (bottom) Eddy heat flux average ‹v*theta*›t cross section of PCM-1 array. Units are cm s-1 °C. Superimposed are the instrument positions: circles for temperature measurements and crosses for velocity measurements.
Both mean temperature transport (referenced to 0°C) and eddy heat flux are concentrated near the mean Kuroshio core. The eddy heat flux of the Kuroshio (integrated cross section) during the PCM-1 period is only 0.007 PW, less than 1% of the total temperature transport.
The time series of the total volume and temperature transport (referenced to 0°C, and the barotropic and baroclinic components as defined above. All time series show the influence of the dominant 100-day period Kuroshio variation in the ETC (Zhang, et al., 2000) though the effect is particularly obvious in the barotropic and total temperature transport, both of which closely resemble the volume transport time series.

Hydrography
To calculate QI, we use the Levitus (1994) climatology across 24°N in the interior (150°E-130°W) combined with an enhanced `Hydrobase' (Curry, 1996) analysis of the available hydrographic station data in the boundary regions. This enhanced hydrography has 0.25 x 0.25 ° in the boundary regions and 1 x 1 ° in the interior for every two months. The average of the station data onto the grids are on isopycnal surfaces to avoid creating artificial water masses in the frontal regions. The obvious difference of this high resolution climatology with Levitus94 is in the western boundary.
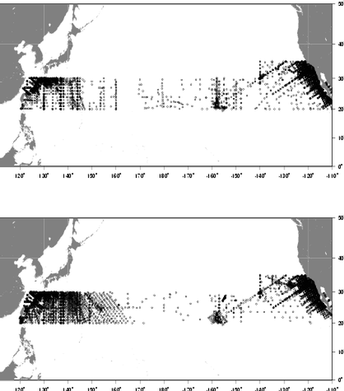
Station locations of all available temperature and salinity measurements (both T and S are measured) in January-February and July-August, representing the worst and best data coverage seasons respectively in the year. The data includes the NODC WOD98, available WOCE and pre-WOCE CTD sections, and the CTD surveys conducted in the western Phillipine basin in the 1990s.
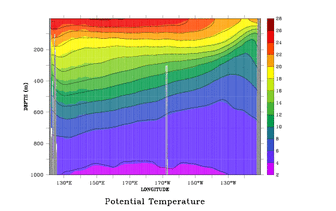
The annual mean potential temperature in the high resolution climatology (shaded) and Levitus94 (contour) along the 24°N section of the Pacific. The only obvious difference is in the western boundary regarding the Kuroshio front: The shear signature of the Kuroshio in the ETC is almost nonexistent in the Levitus94 climatology because of the coarse resolution and the greater smoothing distance; East of the Ryukyus the Levitus94 is warmer due to the artificial spreading of the Kuroshio shear to 130°E.


