Velocities continued
Current-meter records were used with the GEM relative-velocity sections to produce absolute-velocity sections. The GEM method produces time series of relative (baroclinic, geostrophic) velocity. But at a given site a single current-meter time series includes the missing barotropic component of the flow. To minimize error from ageostrophic components in the current-meter records, the GEM relative-velocity profile time series were referenced at each mooring to the deepest current meter without large gaps in its time series. All current meters used for referencing were below 1000 dbar with one exception: at the shallowest mooring site, a single current meter was deployed at 690 dbar. For times when current meters failed, the relative velocity profiles were referenced to the 1800 dbar time-mean of these absolute-velocity profiles. This pressure level was used for referencing because it is deep and has a mean transport per unit depth near zero. Two gaps, one of 25 days and one of 35 days, persist in the absolute-velocity section time series, because of the failure of current meters at mooring sites inshore of IES6; here velocities are higher and using a mean reference may be less accurate.
From these absolute-velocity section time series, several time mean sections were calculated. Shown below are the mean absolute-velocity fields for (a) times when all referencing current meters were working and IES8 was deployed, and (b) the entire record.
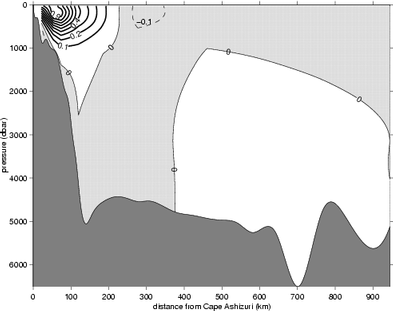
Mean velocity section for a 153-day period between November of 1993 and April of 1994. The contour interval is 0.1 m/s. Contours of eastward flow (thick solid lines), zero flow (solid lines), and westward flow (dashed lines) are drawn. Light shading indicates the region of westward flow. Darker shading indicates topography. The horizontal axis is distance from Cape Ashizuri along the ASUKA line. This field was made by linear interpolation and extrapolation from the means of the eight calculated velocity profile time series. This mean field may have missed a region of westward flow near the base of the continental slope. The GEM technique fails at depth on the slope because of the limited number of available deep hydrographic casts on the slope and because the strong westward flows are not stationary on a stream coordinate axis.
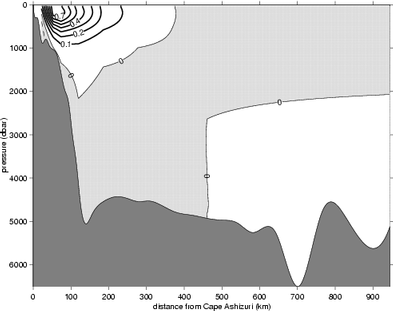
Mean velocity section for a 672-day period between November of 1993 and November of 1995. The contour interval is 0.1 m/s. Contours of eastward flow (thick solid lines), zero flow (solid lines), and westward flow (dashed lines) are drawn. Light shading indicates the region of westward flow. Darker shading indicates topography. The horizontal axis is distance from Cape Ashizuri along the ASUKA line. This field was made by linear interpolation and extrapolation from the means of the seven or eight calculated velocity profile time series. This mean field may have missed a region of westward flow near the base of the continental slope. The GEM technique fails at depth on the slope because of the limited number of available deep hydrographic casts on the slope and because the strong westward flows are not stationary on a stream coordinate axis.
The difference between these two mean sections is caused by the meandering of the Kuroshio. The portion of the ASUKA study when all referencing current meters were working and IES8 was deployed was a 153-day interval in which the only meander which occurred was a single little meander of short duration. The 153-day interval shows the mean velocity section of the Kuroshio in a non-meander state. In contrast, the entire record mean (672 days) averages together intervals of the non-meander state, and several intervals of big and little meanders. This causes the positive velocity contours to spread further offshore and reduces the mean speeds in the Kuroshio core. The time periods of meanders of the Kuroshio can be found from the temperature section time series as will be shown in the transport section of this poster. Using this information, mean sections for meander periods and for non-meander periods were calculated.
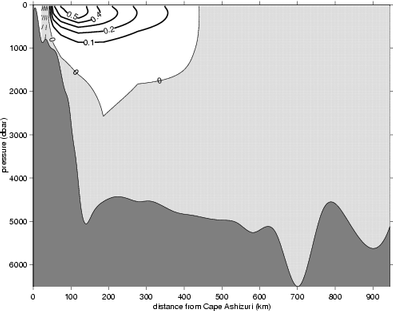
Mean velocity section for the 200 days when the Kuroshio was meandering during the ASUKA study. The contour interval is 0.1 m/s. Contours of eastward flow (thick solid lines), zero flow (solid lines), and westward flow (dashed lines) are drawn. Light shading indicates the region of westward flow. Darker shading indicates topography. The horizontal axis is distance from Cape Ashizuri along the ASUKA line. This field was made by linear interpolation and extrapolation from the means of the seven or eight calculated velocity profile time series.
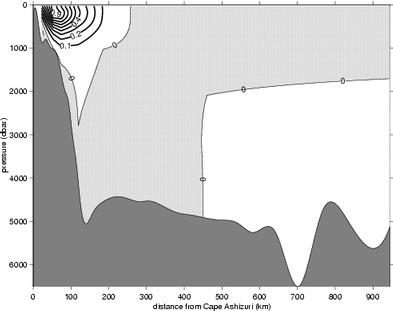
Mean velocity section for 472 days between November of 1993 and November of 1995 excluding times of Kuroshio meanders. The contour interval is 0.1 m/s. Contours of eastward flow (thick solid lines), zero flow (solid lines), and westward flow (dashed lines) are drawn. Light shading indicates the region of westward flow. Darker shading indicates topography. The horizontal axis is distance from Cape Ashizuri along the ASUKA line. This field was made by linear interpolation and extrapolation from the means of the seven or eight calculated velocity profile time series. This mean field may have missed a region of westward flow near the base of the continental slope. The GEM technique fails at depth on the slope because of the limited number of available deep hydrographic casts on the slope and because the strong westward flows are not stationary on a stream coordinate axis.