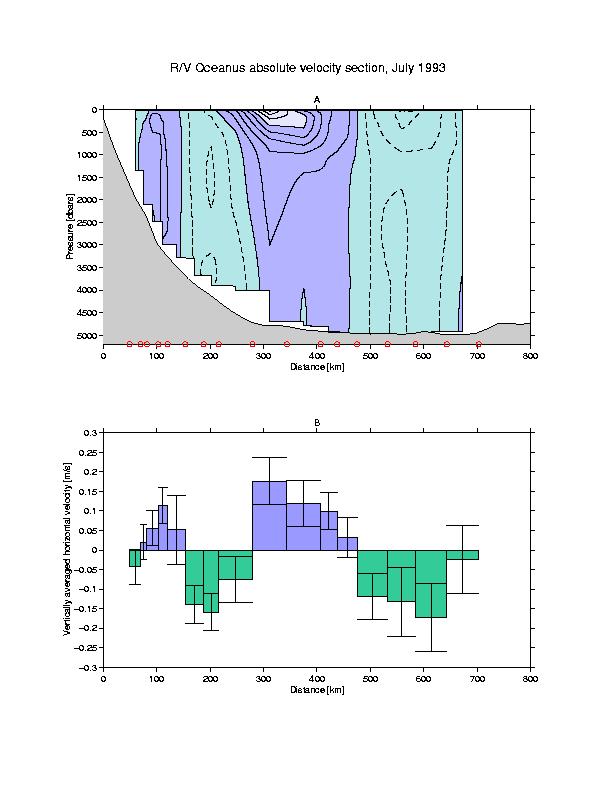
Panel A: The green shading and dashed contours indicate southward
velocities, the medium blue denotes northward velocities less than 50 cm/s,
and the light blue denotes northward velocities greater than 50 cm/s.
Contour level is 10 cm/s. Red circles on lower axis indicate CTD sites.
Gray shading indicates the ocean bottom. Panel B: The error bars indicate
the accuracy of the absolute reference velocity. Green shading indicates
southward velocity, blue indicates northward.