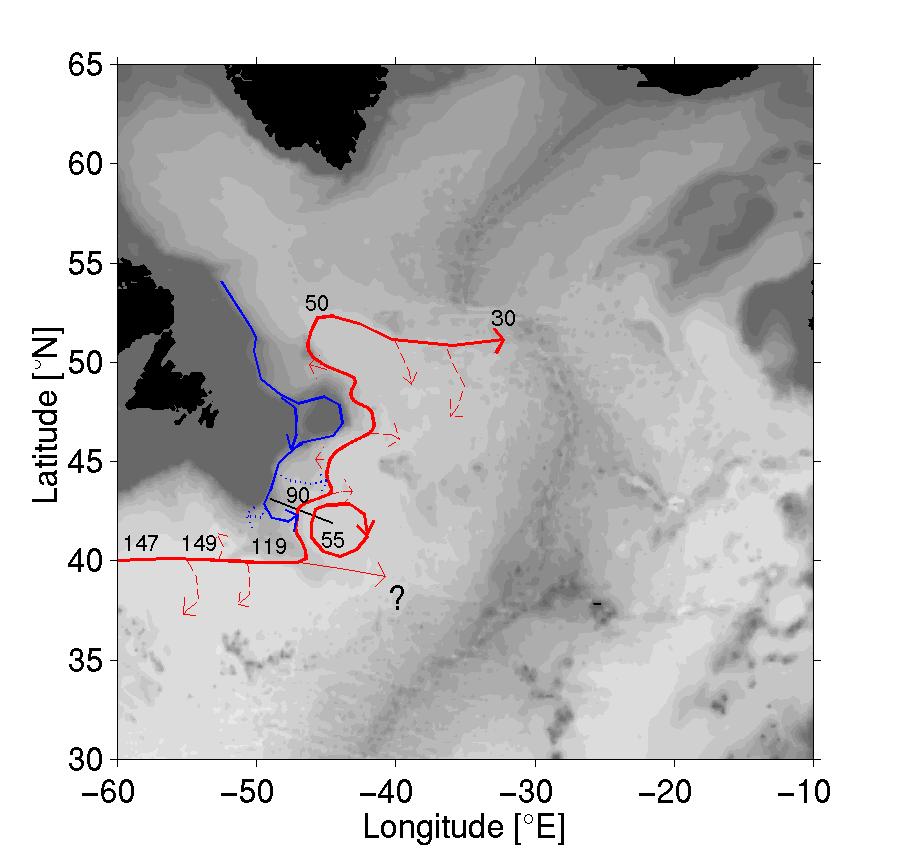
This cartoon represents the large scale circulation in the northwest
North Atlantic Ocean. The short black line represents the line of instruments
maintained in this study. The blue line denotes the cold Labrador Current flowing
southward along the shelf break. The blue dotted lines represent alternate
pathways for some of the Labrador Current waters in addition to the main
pathway which retroflects near 42N and then flows northward along the inshore
edge of the North Altantic Current. The latter is denoted by the long red
line, as it brings warm waters northward from the Gulf Stream. The large red
eddy feature represents the Mann Eddy, which is believed to be a permanent
circulation feature in this region. The thin solid red line indicating flow
eastward near 40N and -47E denotes the Azores Current. The thin dashed red
lines indicate possible recirculation pathways all along the Gulf Stream and
North Atlantic Current. These are not intended to represent permanent
jet structures. The transport loss may be broadly distributed or localized,
contributing to recirculation on either side of the currents. The numbers
represent absolute transport estimates in Sverdrups made
at the indicated location during this and other studies. One exception is the
30 Sv estimate at the Mid-Atlantic Ridge, which was determined relative to a
level of no motion at the top of the ridge. The question mark indicates the
lack of an absolute estimate for the Azores Current transport. The 90 Sv
throughput observed along our transect and the 30 Sv estimate of the flow
leaving this portion of the basin provide the impetus for our hypothesis that
there is significant recirculation occuring either inshore, offshore, or on both
sides of the North Atlantic Current.