
| Results |
|
|
|
|
|
|
|
|
|
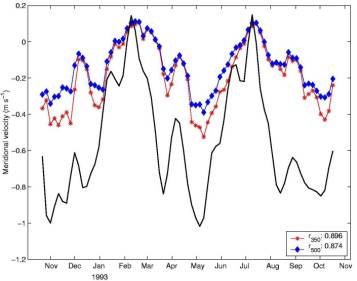
| Figure
9: Surface meridional geostrophic velocity |
||||||||
| across
the PCM3 array estimated from |
||||||||
| MSLA+CARS
SSDT data (thick) and mean |
||||||||
| velocity
from the PCM3 current meter at 350 m |
||||||||
| depth
(*) and 500 m depth (u). The values in the |
||||||||
| bottom
right box indicate the correlation |
||||||||
| coefficient
between the respective current meter |
||||||||
| series
and the Altimeter estimate. Negative |
||||||||
| values indicate
southward flow. |
||||||||