|
|
|
|
|
|
|
|
|
|
|
|
|
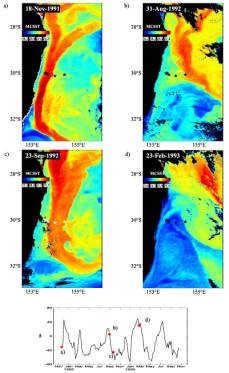
Figure
6 shows two pairs of Sea Surface Temperature
|
|
|
(SST)
images of the study area. In two of them (18
|
|
|
Nov,
1991 and 23 Sep, 1992), the EAC is present as a
|
|
well
defined current that flows across the mooring
|
|
array
and separates from the coast around 32° S.
|
|
|
However,
in the other pair (31 Aug, 1992 and 23 Feb,
|
|
1993)
it appears the EAC changes its separation point
|
|
|
and
is no longer flowing across the array. Instead,
|
|
|
colder
water from the southern Tasman Sea occupies
|
|
a
cyclonic circulation in the area of the array. As
|
|
|
demonstrates,
times when the EAC has separated
|
|
north
of the array coincide with weak southward or
|
|
|
northward
volume transport. Hence, it is expected that
|
|
the
mean volume transport obtained by the PCM3
|
|
array
is an underestimate of the net southward flow
|
|
|
through the
region [Mata et al., 2000].
|
|